The pedigree provided must have the following columns: sex and
age. This needs to be augmented to allow pedigrees structures that
are provided by the nprcgenekeepr package.
Usage
getPyramidPlot(
  ped = NULL,
  binWidth = 2L,
  ageUnit = "years",
  colorScheme = "default",
  showCounts = TRUE,
  ageLabelCex = 1
)
Arguments
- ped
The pedigree information in data.frame format
- binWidth
numeric bin width for age groups (default 2). The value is truncated to a whole number and is at least 1, so 0.5 gives 1 and 2.9 gives 2.
- ageUnit
character either "years" (default) or "months".
- colorScheme
character color scheme: "default" (blue/pink) or "viridis" (colorblind-friendly).
- showCounts
logical whether to show count values on bars (default TRUE).
- ageLabelCex
numeric expansion factor for age labels (default 1.0).
Details
Only living animals are plotted: when ped has an exit
column, animals with a non-NA exit are dropped, and only
animals with sex "M" or "F" are counted. The age axis is, however, sized
from the oldest animal in ped, including deceased ones. When
ped is NULL (the default), the packaged qcPed example
data are used. An unrecognized colorScheme silently falls back to
"default".
Examples
library(nprcgenekeepr)
data(qcPed)
getPyramidPlot(qcPed)
 #> 15 15
#> [1] 5.1 4.1 4.1 2.1
getPyramidPlot(qcPed, binWidth = 5, colorScheme = "viridis")
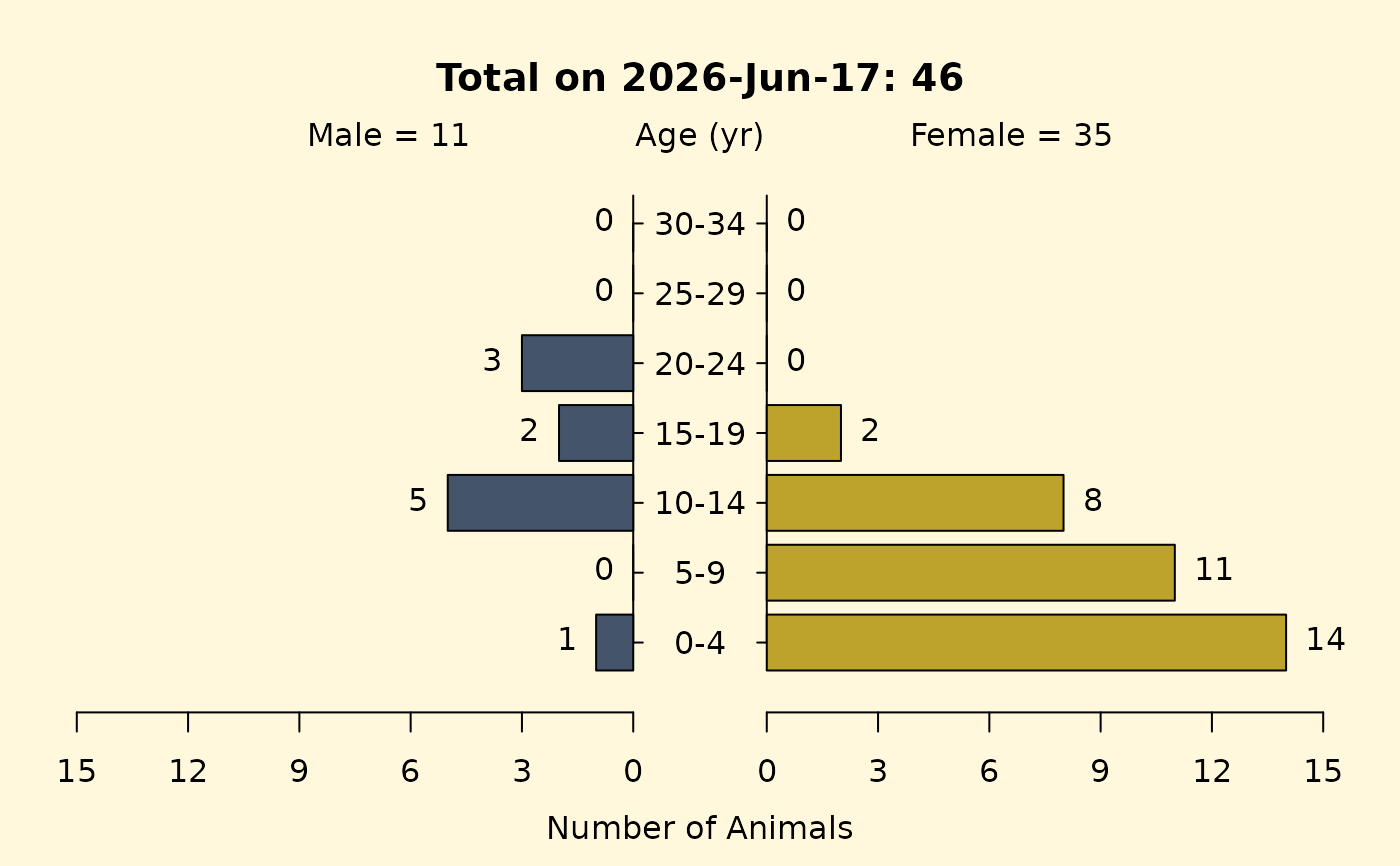 #> 15 15
#> [1] 5.1 4.1 4.1 2.1